jtr0view: (.gz archive Download)
jtr0view: (.zip archive Download)
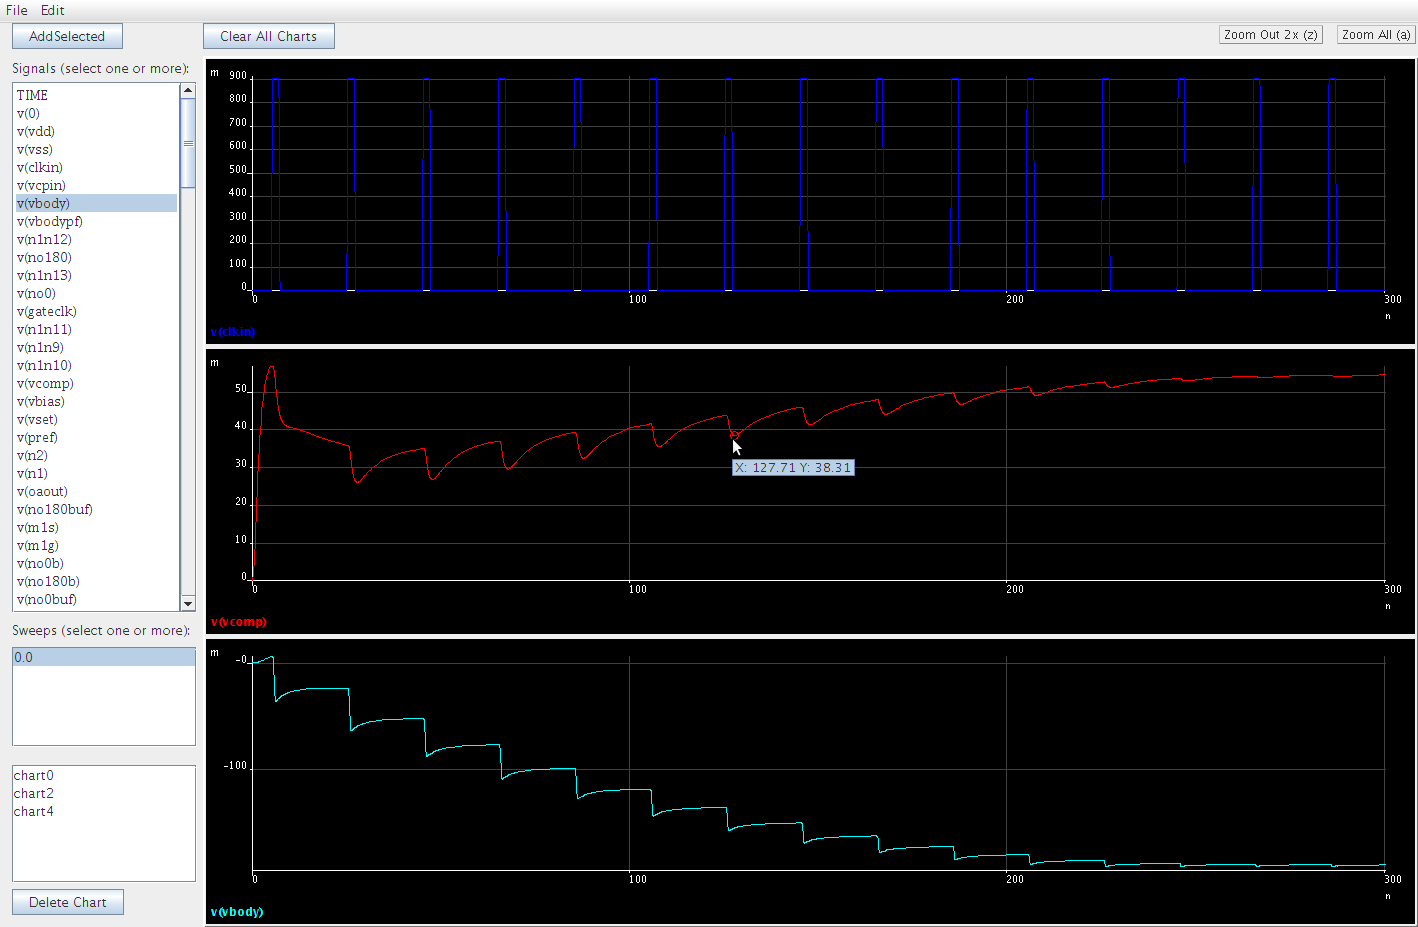
A Java based binary transient and dc sweep waveform viewer for displaying binary format Hspice output files (.tr0 and .sw0). It will not work with ascii format .tr0 or .sw0 files. Data must be saved with ".option post" or ".option post=1" in the Hspice input file.
jtr0view is a very basic waveform viewer, but works for many viewing tasks. The source code is available upon request. Charting is based on the open source Java package jChart2d, and this package includes the jChart2d-3.1.0.jar archive.
Contact curt@mixedmode.com for advance access to the source code or for basic support
The documentation is limited to what appears on this page. This software comes with no guarantees. It has been tested on Windows and Linux systems.
Get Started: unzip/untar the download, then in the tr0view directory, type: tr0view. tr0view is a shell script which runs "java -jar jtr0view.jar"
- under the "File" menu, select Open
- Find your *binary* .tr0 (transient) or .sw0 (DC sweep) file, and click on the "open" button
- Click on one of the signal names in the left column of the window (or multiple signal names by holding down Shift or Cntrl), then either drag the selection to the box to the right to plot the data, or click the "add selected" button just above the signal names column. If there are multiple sweeps from a transient sweep run, click on the sweeps to display as well before adding the signals. All selected signals will be displayed on the same chart. Selecting another signal or set of signals and dragging to the chart area will produce another chart. There is currently no way to add additional signals to an existing chart, so plan ahead.
- Panning is done with the arrow keys, zooming in is done by left clicking inside of the chart and dragging over the area to be zoomed in on. Zoom out by 2 is done by either typing "z" or clicking the "zoom out by 2" button, and zoom all is done by typing "a" or clicking the "zoom all" button.
- The data can be reloaded if the .tr0/.sw0 file has been regenerated by typing "r"
Known issues: 1.) There is no way to tell by looking at the charts which of the sweeps the waveform came from in multiple sweep scenarios. 2.) Zoom out in the y axis is not implemented except in "zoom all". In other words, if you zoom in on the y axis, the only way to unzoom is to "zoom all" 3.) The .tr0 data import routine loads ALL data from the file at once and stores it into memory (for simplicity). This will be a problem for systems with small amounts of memory, or for large .tr0 files. Future enhancements could fix the issue at the expense of signal load speed (the .tr0 file would have to be read each time a new signal is plotted and only the required data stored) 4.) if a chart is added while other charts are zoomed, the x-axis will not be locked to the others until a pan or zoom in/out is performed. Locking the x-axis on the current point with the added chart can be accomplished by panning left then right (or right then left...) using the arrow keys
Hspice is a registered Trademark of Synopsys, Inc.
